The Overview is the home panel of StarNapp. It brings together important information about nautical activity so we can review your situation without entering each section individually.
The data displayed will depend on our user's permissions and the information registered in StarNapp.
We will click on Overview, located at the top of the left side menu.
When accessing it, we will find different panels with financial information, scheduled activities, work orders, and personal records.
In My agenda we will consult the events associated with our user.
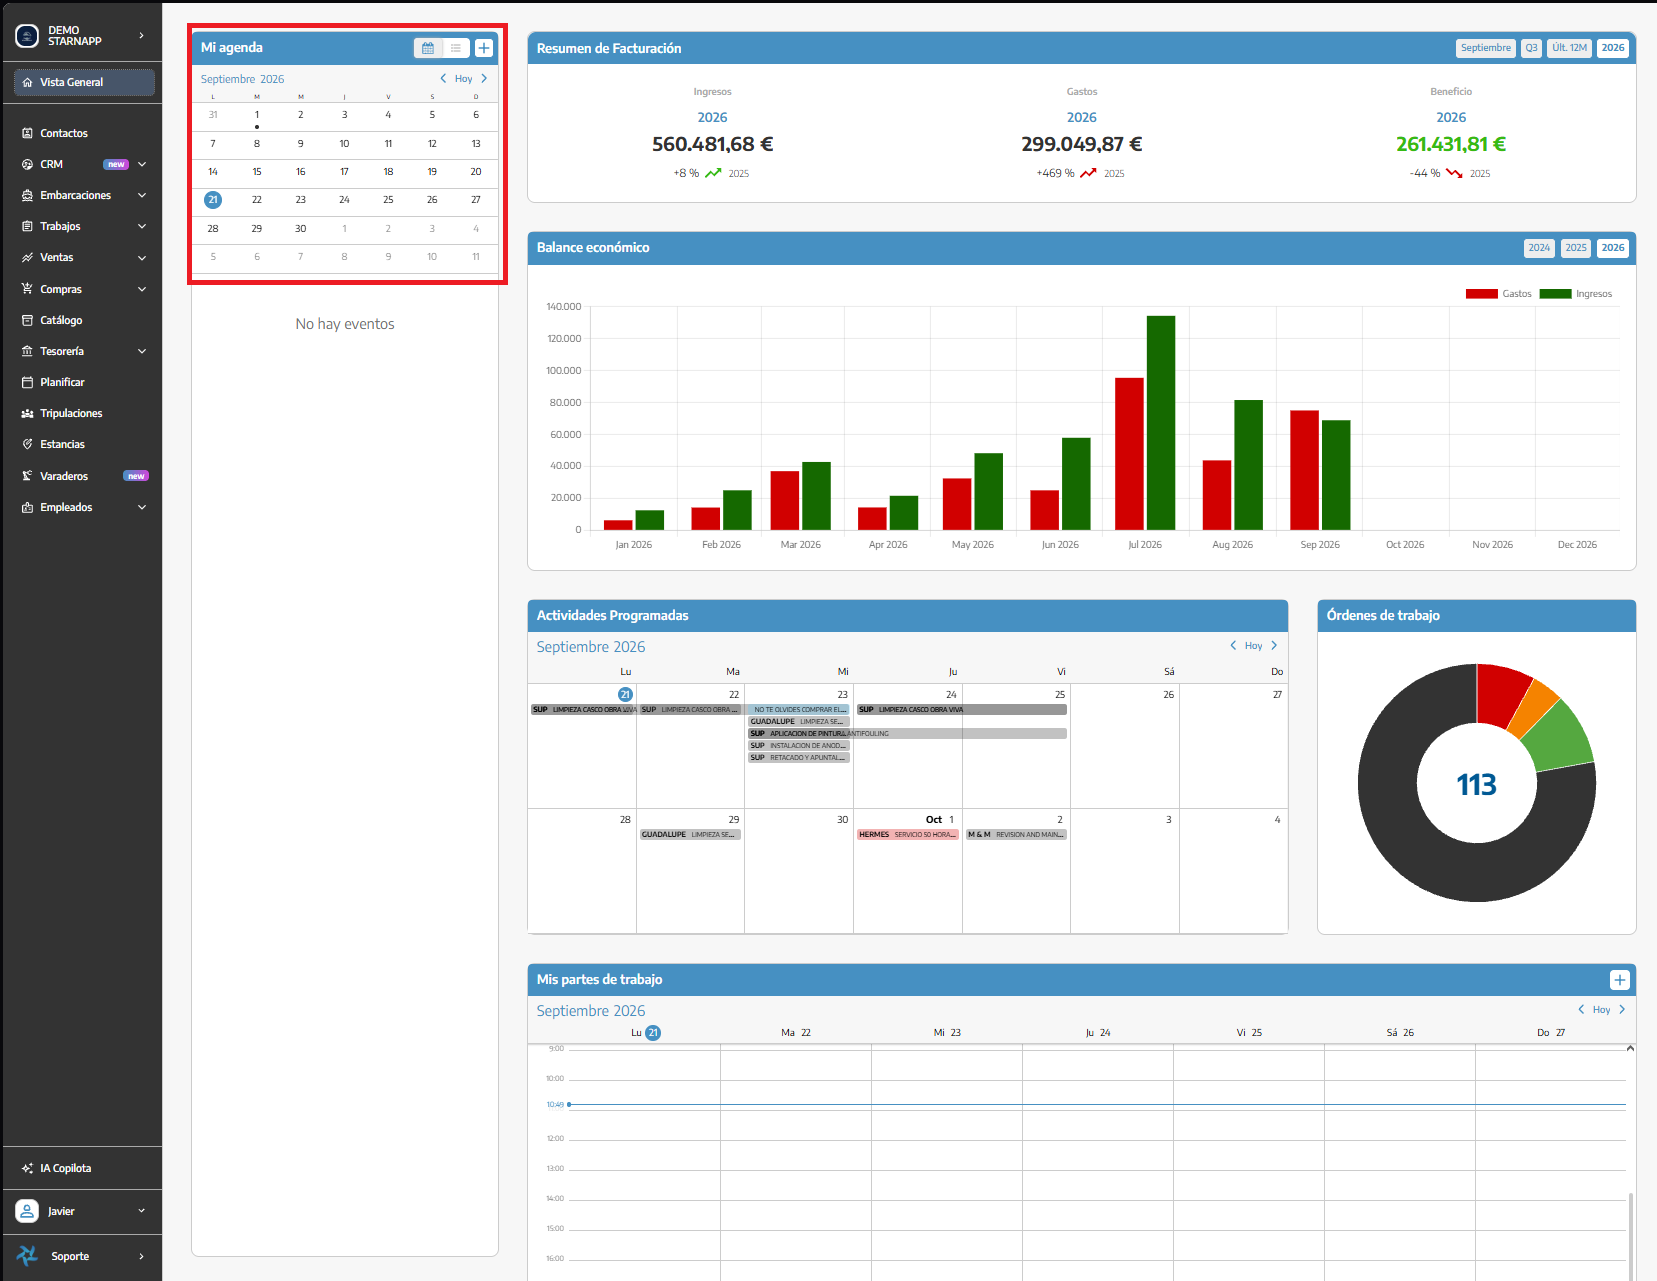
We will be able to:
Switch between calendar view and list view (located next to the + button).
Move forward or backward between dates.
Quickly return to today using Today.
Create a new event with the + button.
If there are no events registered for the selected period, the message No events will appear.
This panel shows a summary of the main financial results:
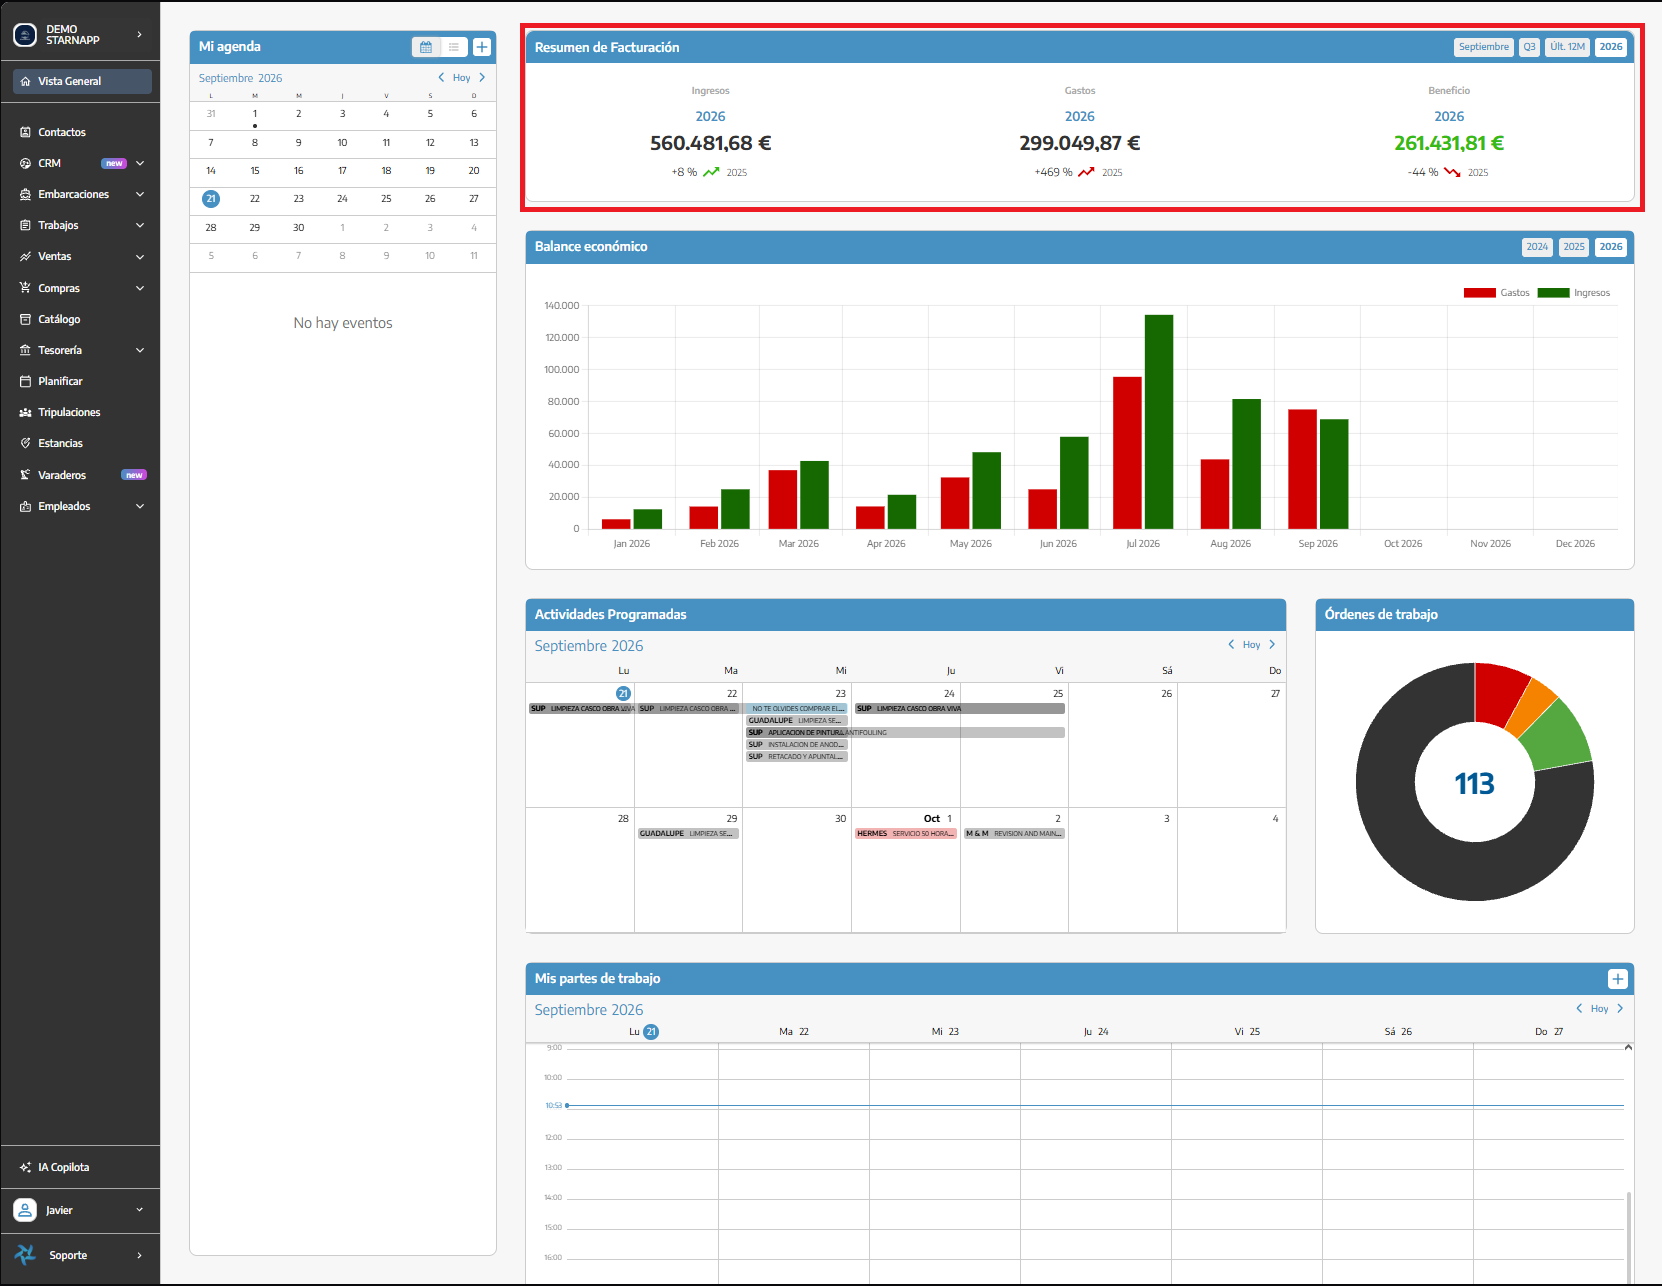
Revenue: amount generated during the selected period.
Expenses: expenses recorded during that same period.
Profit: difference between revenue and expenses.
Below each amount, you will be able to see its variation compared to the previous period used as a reference.
In the upper right part, you will be able to change the query period, for example:
A specific month.
A quarter.
The last 12 months.
The current year.
The amounts in the summary are calculated based on the financial information recorded in StarNapp. If documents or transactions are missing, the results shown may also be incomplete.
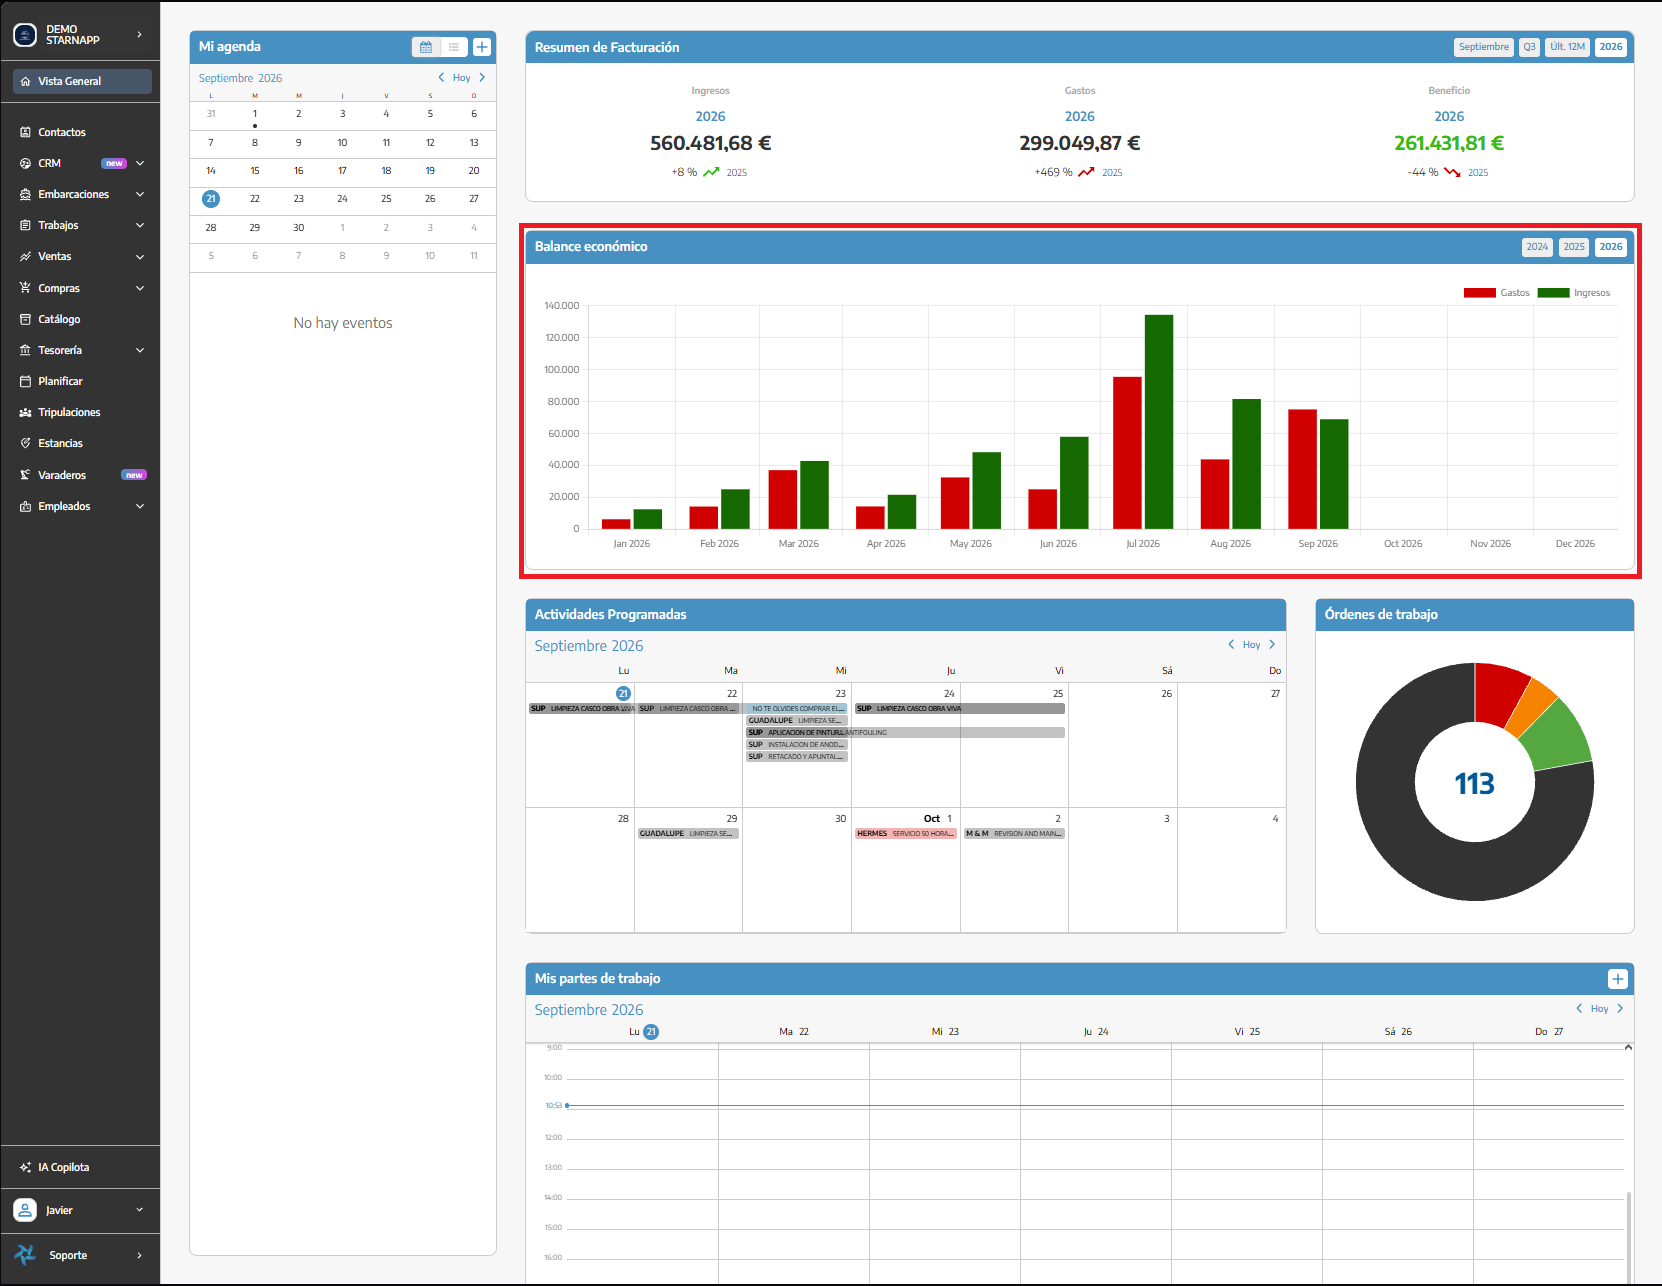
The Economic Balance graphically represents the monthly evolution of income and expenses:
The green bars represent income.
The red bars represent expenses.
We can select the year we want to consult from the buttons located in the upper right part.
This graph allows us to quickly detect the months with the most activity and compare the evolution of income and expenses.
In Scheduled Activities we will see the activities distributed in the calendar according to their planned date.
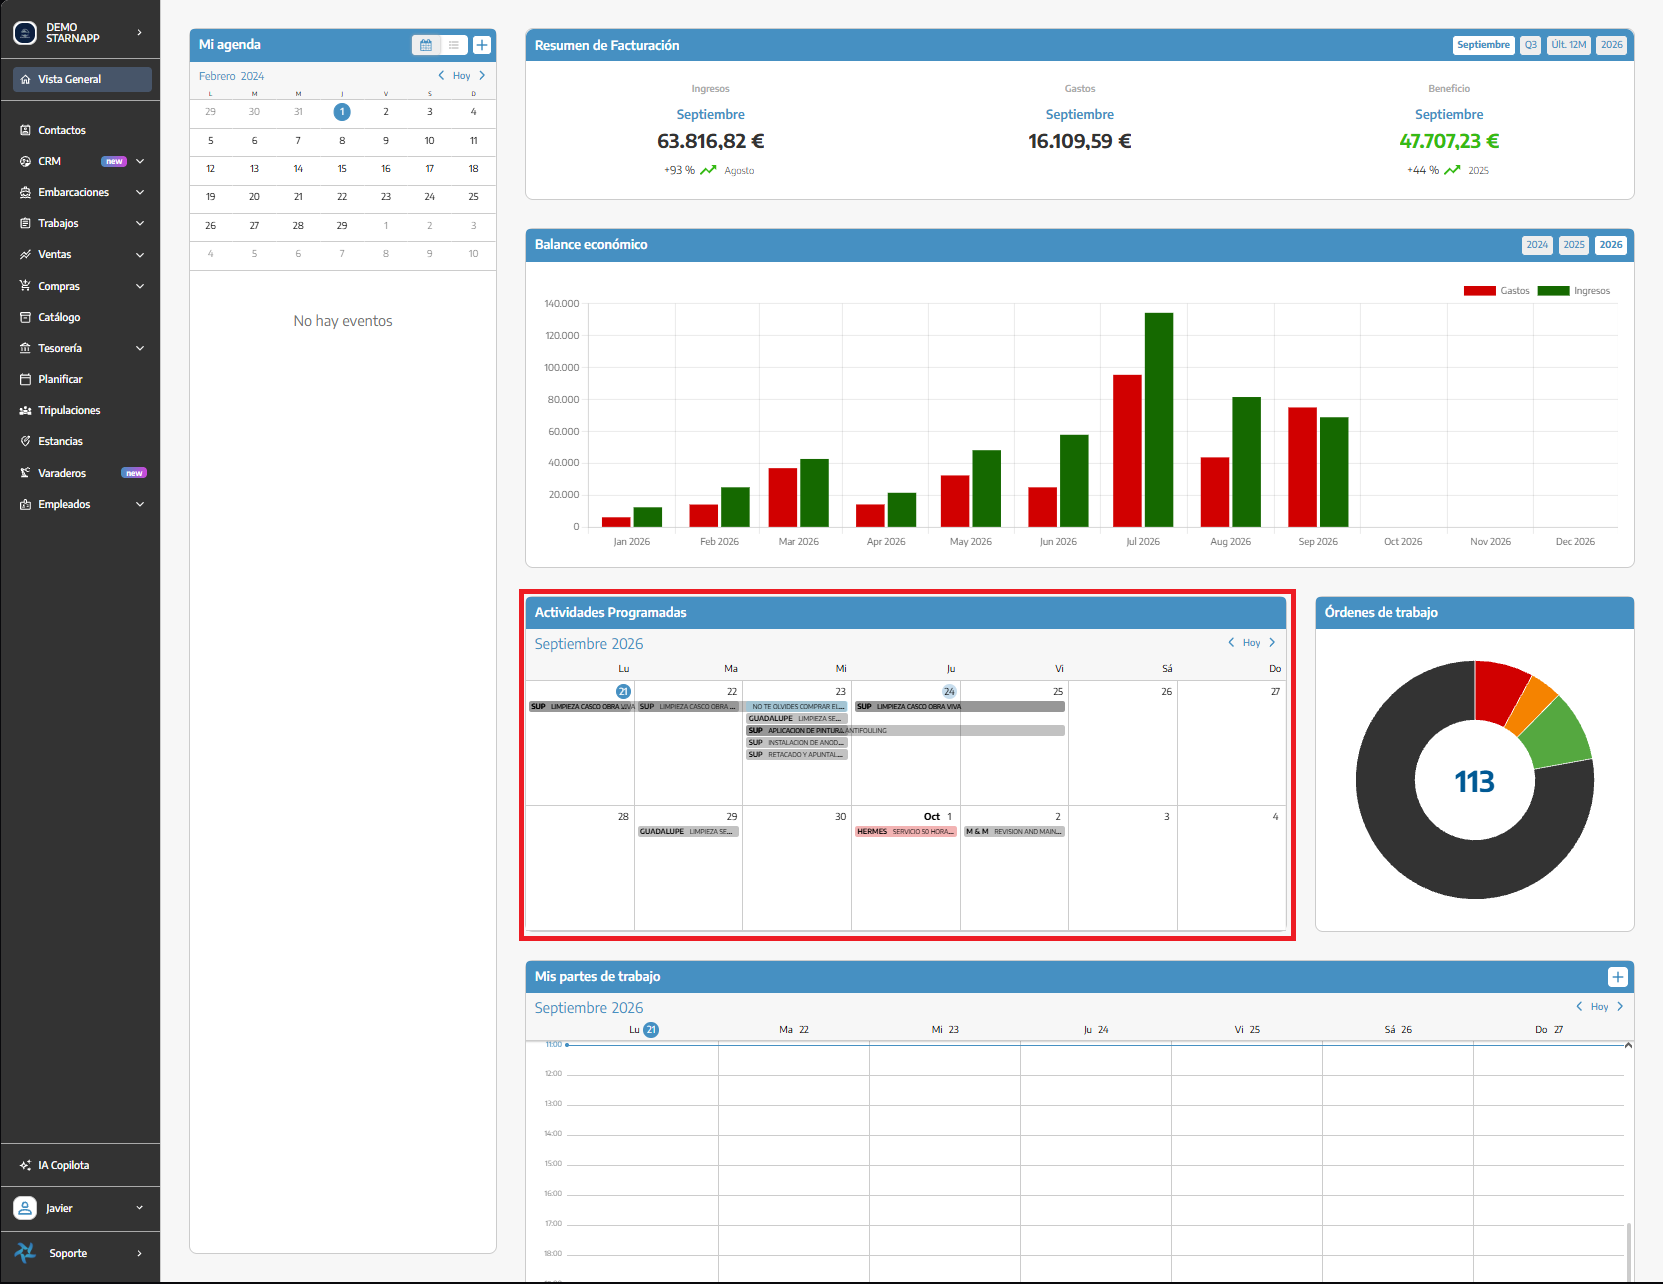
We can:
Check the activities assigned to each day.
Move forward or backward between periods.
Return to today's date by clicking Today.
This panel offers a quick view of the scheduled workload. Detailed planning will be explained in the guide corresponding to the Plan section.
This graph shows a summary of the work orders and their distribution by status.
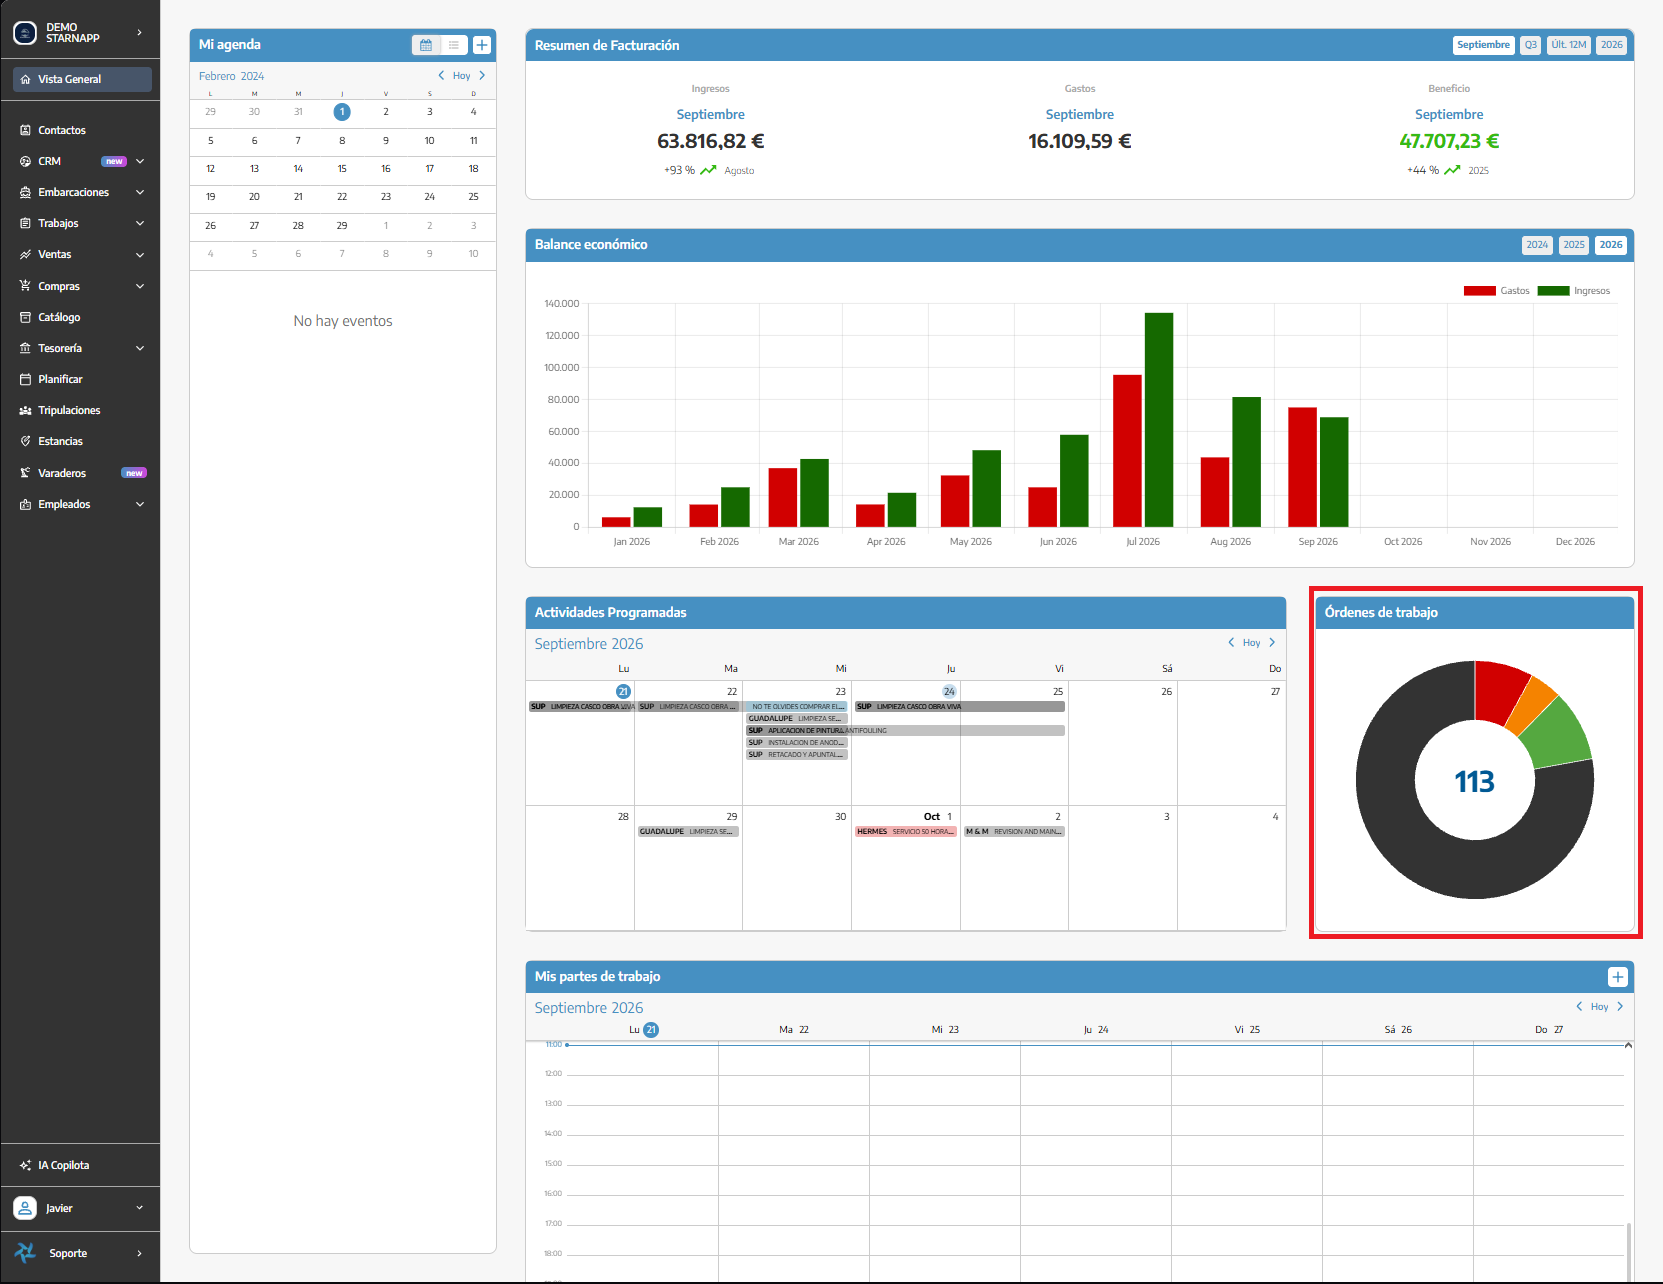
The number in the center indicates the total number of orders included in the summary. The different colors represent the states in which they are located.
This panel allows you to quickly check the volume of work and detect if there are many pending, in progress, or completed orders.
The creation and management of orders will be explained in the Jobs section.
In My timesheets we will consult the time records associated with our user.
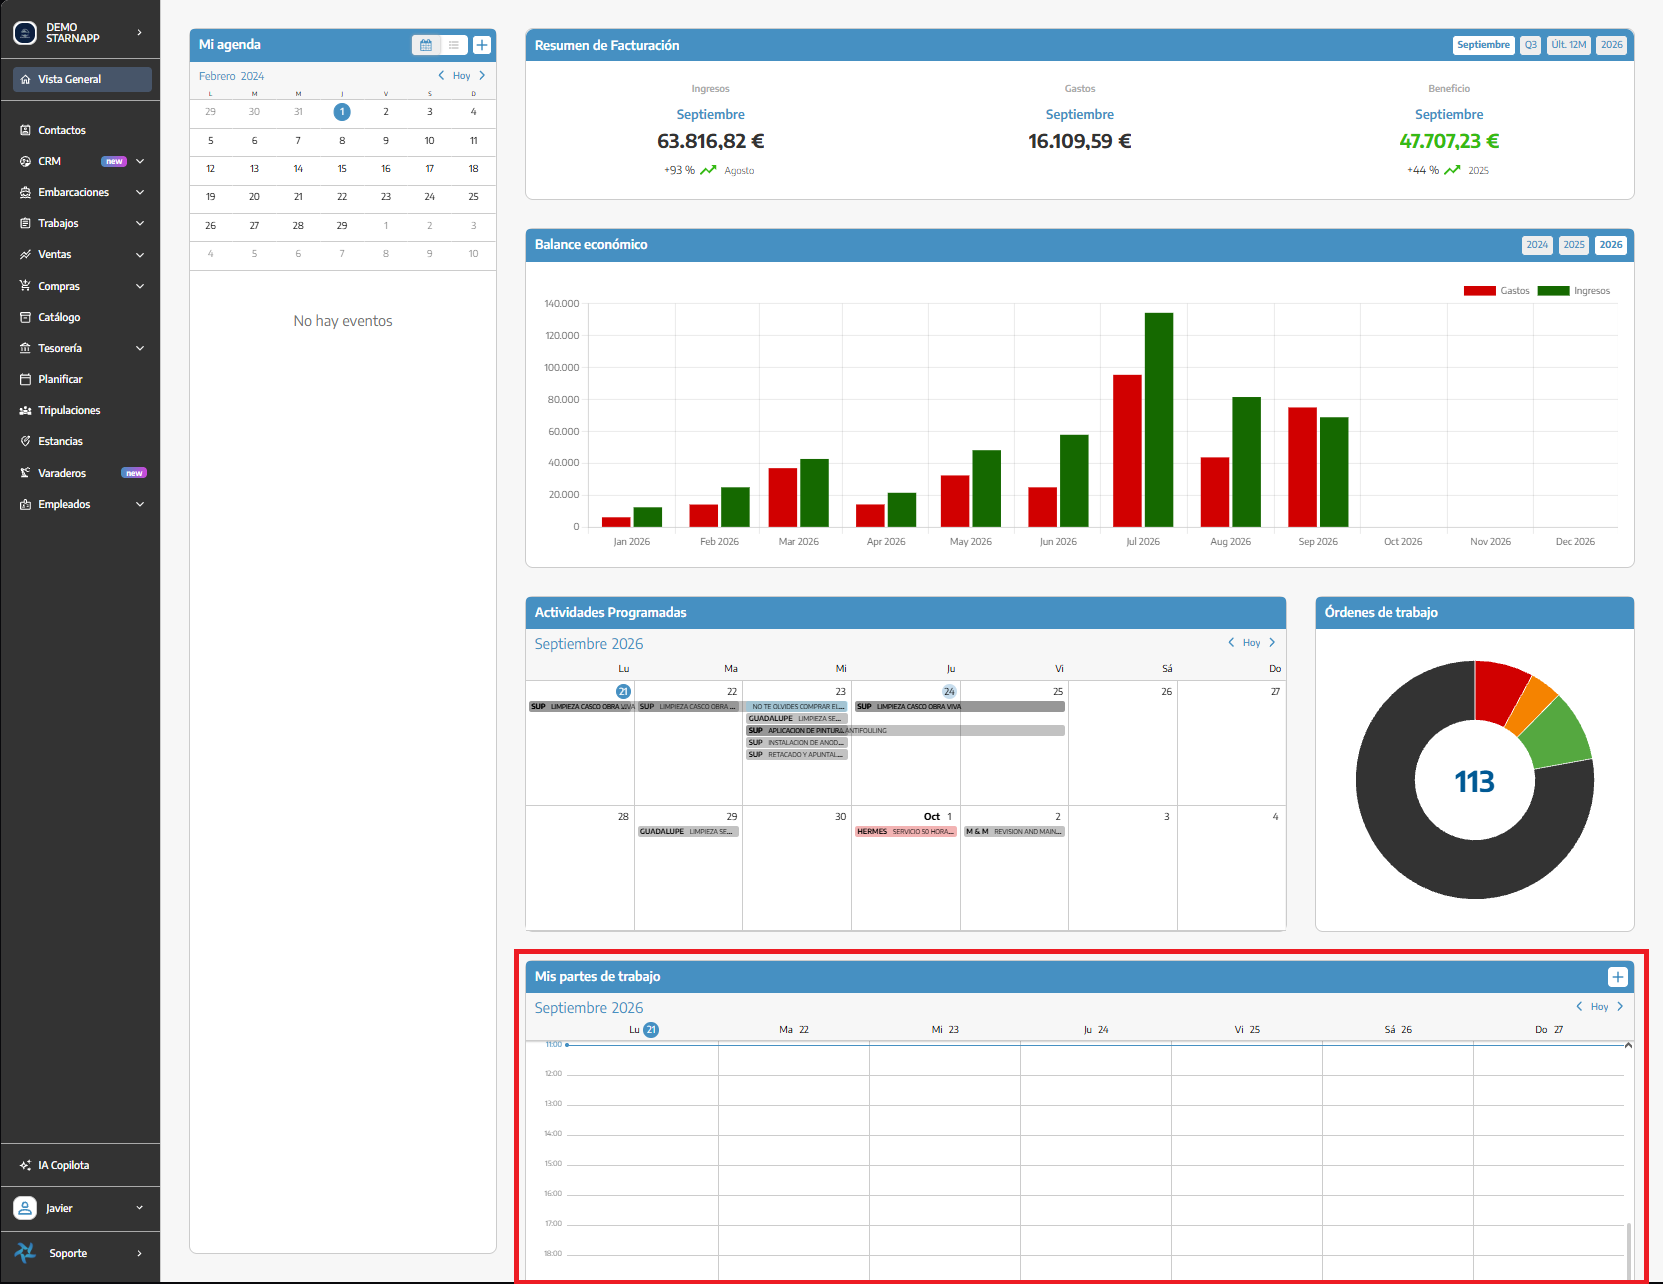
The calendar shows the distribution of timesheets during the week and allows you to:
Move forward or backward between weeks.
Return to the current week using Today.
Add a new record using the + button.
This panel is personal: it shows the reports corresponding to the logged-in user, not the records of the entire company.
The Overview works as a summary; detailed management is carried out from each menu section.
Economic results change according to the selected period.
The information displayed depends on the data recorded in StarNapp.
Some panels may appear empty when there are no events, documents, orders, or work reports yet.
The visible sections and available information may vary depending on user permissions.
From this screen we do not need to explain Contacts, CRM, Sales, or the rest of the menu: each area will have its own guide.